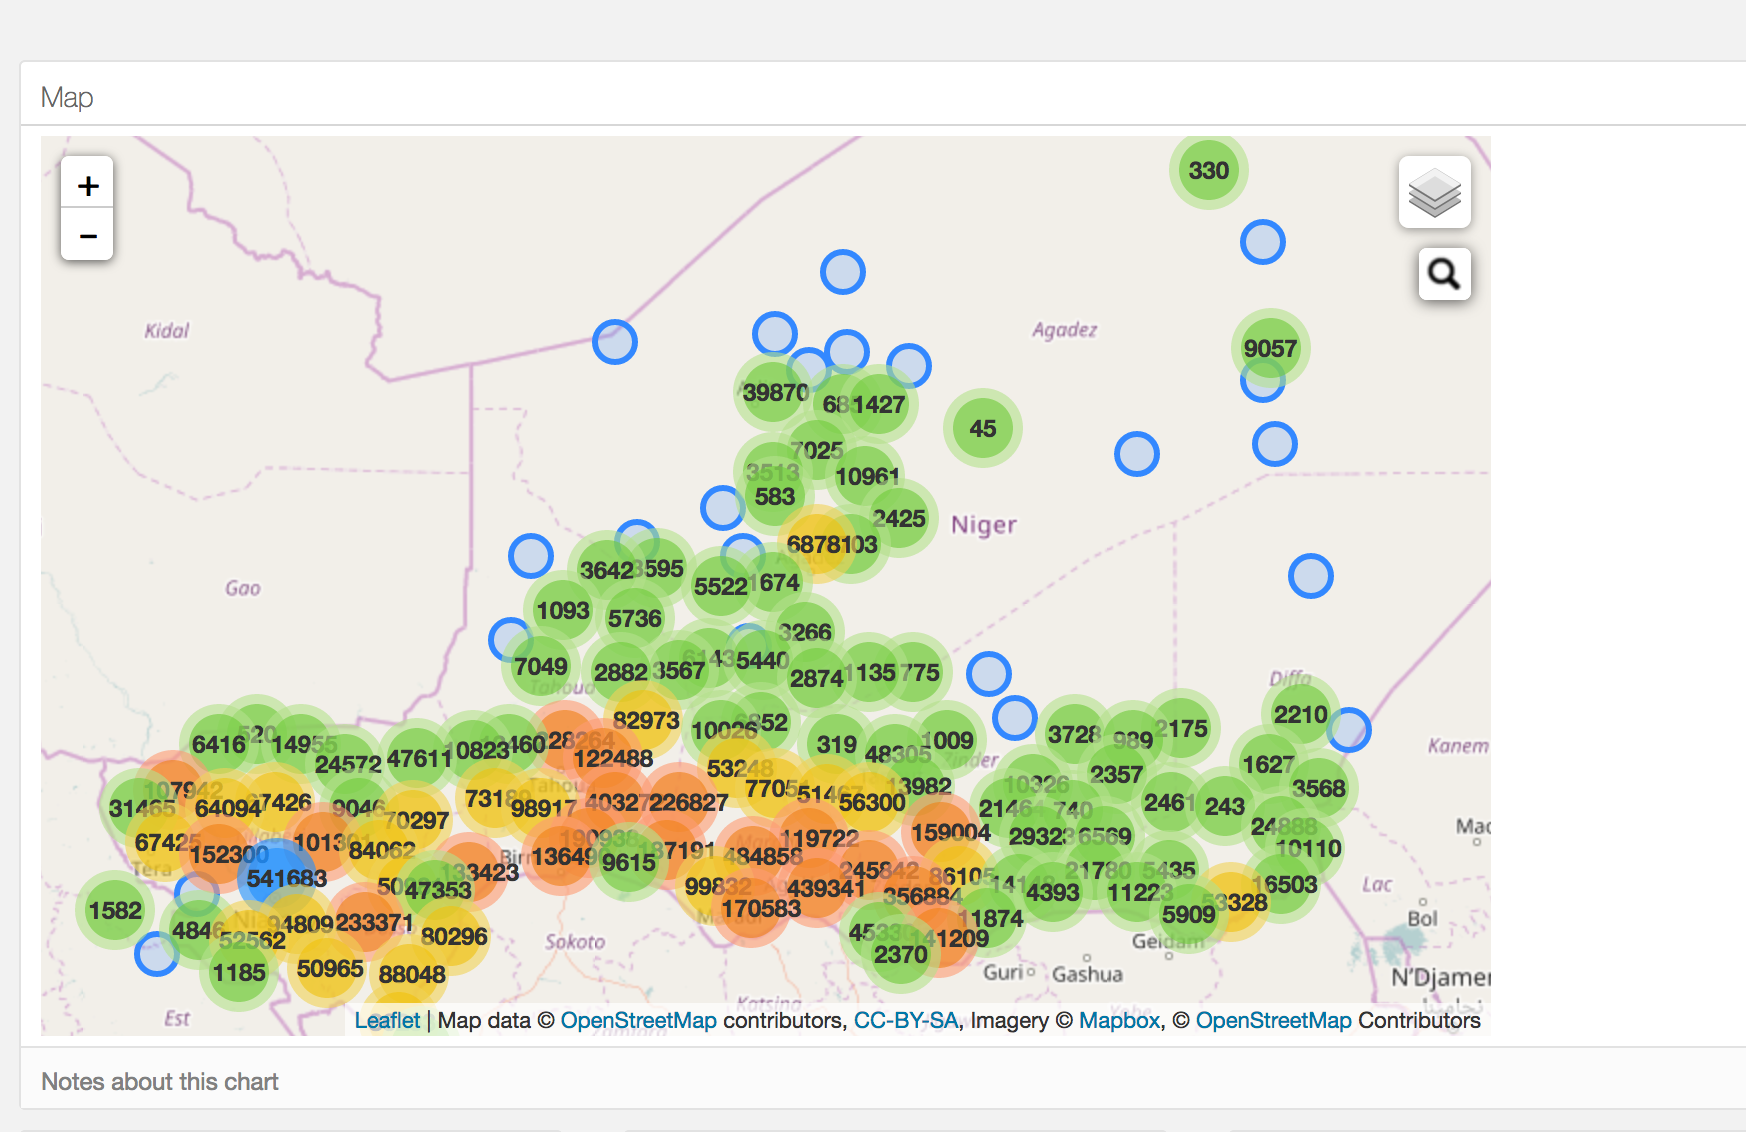
This project involved the construction of a visualization to plot the population of the country Niger using election data. The tools utilized in this project include Flask - for the web application server, MongoDb- used as a database, Javascript, HMTL, CSS - for the front side webpage, Leaflet.js - For creating marker cluster groups and OSM ( Open Street Maps ) as the mapping plugin
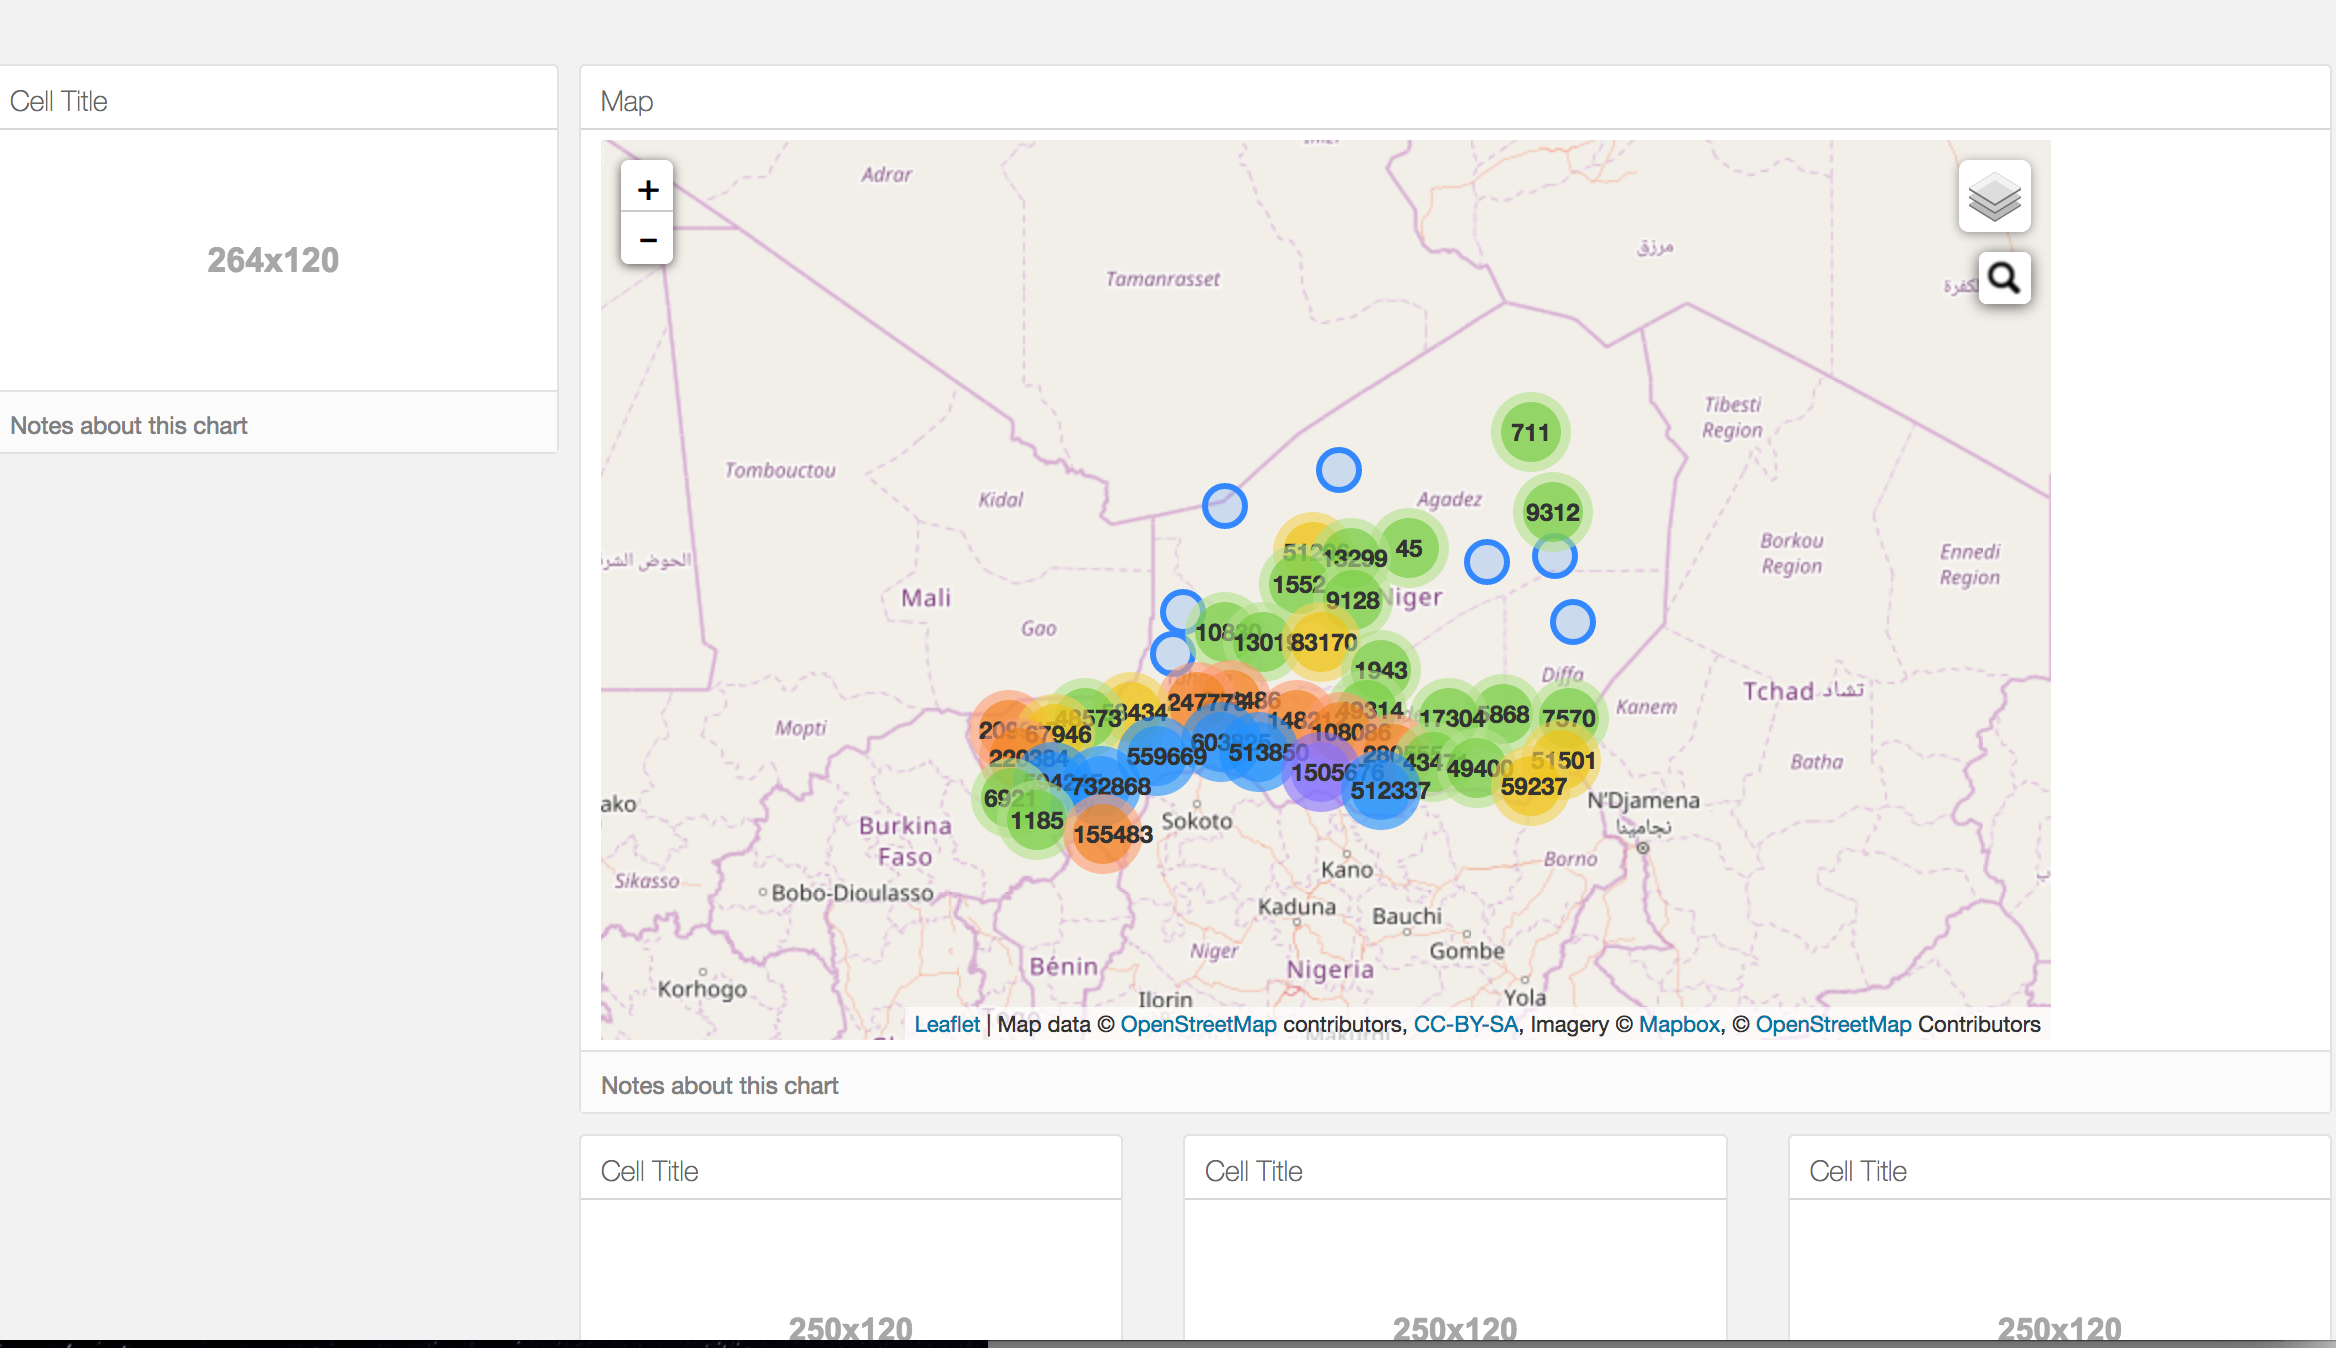
By zooming in we can see that the larger clusters separate further. There is a search button provided to query villages that are located in Niger. The largeness of a cluster is distinguished by color. The cluster sizes are represented by the population in those particular cluster regions. A layer button is provided for switching between different layers such as sattelite view, grayscale, etc.
Creating the Flask Server:
Create the application route, which would render an index.html file
@app.route("/")
def index():
	return render_template("index.html")
if __name__ == "__main__":
	app.run(host='0.0.0.0', port=5000, debug = True)
Connection with MongoDB:
We first need to set up a connection as MongoDB Client to the MongoDB Server. This is where our data is stored. The following lines of code list out the parameters needed for setting up a connection. We route the data to voters/project, a json object is returned from this function which is then accessed by Javacript in order to create the visualizations
MONGODB_HOST = 'localhost'
MONGODB_PORT = 27017
DBS_NAME = 'voter'
COLLECTION_NAME = 'project'
FIELDS = {'locality' : True, 'latitude': True, 'longitude': True, 'population': True, '_id':False}

@app.route("/voters/project")
def voters_project():
	connection = MongoClient(MONGODB_HOST, MONGODB_PORT)
	collection = connection[DBS_NAME][COLLECTION_NAME]
	projects = collection.find(projection = FIELDS)

	json_projects = []
	for project in projects:
		json_projects.append(project)
	json_projects = json.dumps(json_projects, default = json_util.default)
	connection.close()
	return json_projects
Using Leaflet.js and OSM:
We fetch the data that is on the Flask Server using the following code
queue()
	.defer(d3.json,"/data")
	.await(makeGraphs);
A snippet of the code that is used to create the circle markers and plot them on the map is shown below :
local_marker = L.circleMarker([lat,long] , {title: locality , n_population: n_population}).bindPopup(popup).openPopup() ;
				local_marker.n_population = records[i].n_population ;
				markers.addLayer(local_marker) ;